
An armor system is often judged by how it performs at the limits – in those rare, unpredictable moments where performance matters most. For decades, V50 ballistic limit has served as the standard reference value for ballistic armor performance. But it doesn’t tell us the full story.
To design armor that performs with consistency and confidence, we need a deeper view of how it behaves across the entire range of impact velocities. That’s where S-curve analysis comes in.
V50 and the value of the full S-curve
Before going further, let’s briefly define V50. It refers to the velocity at which there is a 50% chance that a projectile will fully perforate the armor. This makes it a useful reference point when comparing the ballistic efficiency of different materials or armor configurations. But it doesn’t clearly show how reliably the armor will perform.
To better assess real-world performance, we use S-curve analysis. This statistical method uses logistic regression to calculate V05, V50, and V95 from a single dataset. It also allows us to estimate the probability of perforation at any given impact velocity while providing confidence levels for the results.
V05 and V95 represent the velocities at which there is a 5% and 95% chance of complete perforation, respectively. Of these, V05 is especially important. It shows how far beyond the required threshold the armor continues to protect. It also aligns more closely with the velocities typically encountered in the field, making it a more realistic indicator of safety margin.
To ensure a sufficient safety margin, the V05 should exceed the maximum required reference velocity (Vref max) defined in the relevant test standard.
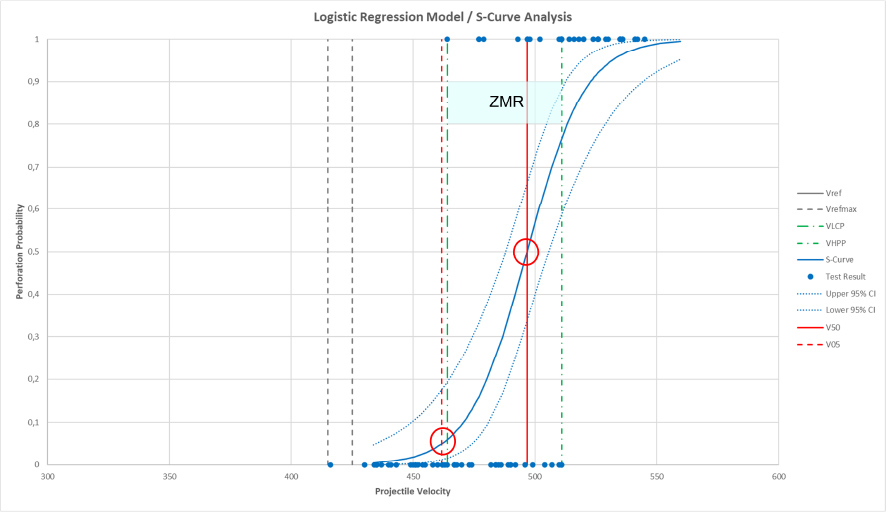
Figure 1 below illustrates the S-curve of a ballistic vest, including the associated confidence bounds. The uncertainty in V05 is typically greater than for V50, which means that accurate estimation of V05 requires a larger number of test shots, especially at lower velocities. The figure also highlights additional test parameters that support a more detailed performance assessment.
Assessing ballistic performance
A reliable armor solution requires more than just a strong V50. It also depends on additional indicators that help define how consistently the system performs under pressure.
Additional performance indicators include:
- VLCP (Velocity of Lowest Complete Perforation): the lowest impact velocity at which a complete perforation occurs. Higher values are preferable.
- VHPP (Velocity of Highest Partial Perforation): the highest velocity at which the armor successfully stops a projectile.
- ZMR (Zone of Mixed Results): the gray area where the armor sometimes stops the bullet and sometimes doesn’t. A narrower ZMR reflects more consistent performance and is represented by a steeper S-curve.
Ballistic systems with a steep S-curve, or narrow ZMR, offer more predictable performance. In these cases, the confidence bounds around V50 and V05 are tighter, supporting a more accurate and reliable assessment of ballistic resistance.
While each indicator provides useful insight on its own, their value becomes even clearer when used together to compare different armor systems in practice.
Comparison of armor systems
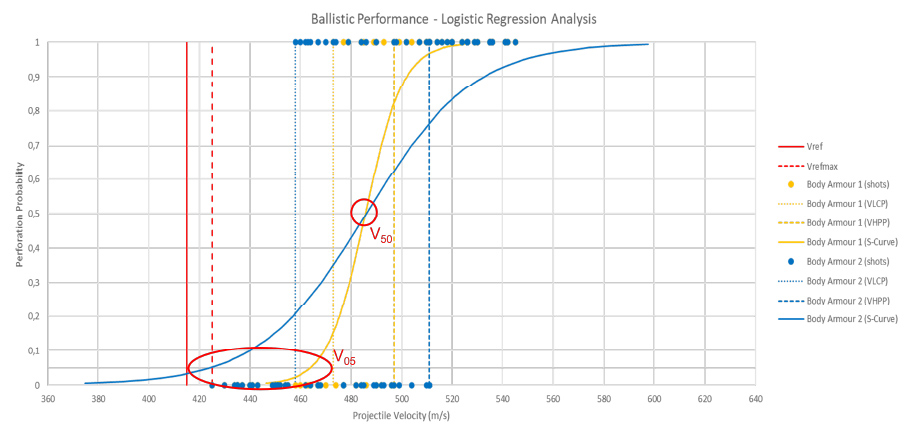
Figure 2 illustrates how two armor systems with the same V50 can deliver very different performance outcomes. The figure also includes Vref and Vref max, which represent the required and maximum test velocities defined by standards such as VPAM or NIJ. In this example, both the blue and yellow systems reach the same V50 value, which may suggest both armors offer similar ballistic efficiency.
However, the yellow armor shows a steeper S-curve, shaped by a narrower ZMR. This leads to a significantly higher V05, indicating that it continues to protect at impact velocities above Vref max with greater consistency. The blue system’s V05falls below the Vref max threshold, suggesting a higher risk of complete perforation within the required test velocity window.
Although both systems have the same V50, the yellow armor provides a more predictable and reliable safety margin due to its steeper curve and higher V05, while the blue system, with a more flat S-curve, does not offer any safety margin.
This comparison highlights why it is essential to look beyond V50 when evaluating armor systems and to consider how design choices influence reliability across the full velocity range.
Hybrid armor design
Differences in performance, such as curve steepness or ZMR width, often come down to material choice. There’s no single material that does it all. Designing reliable armor means making a smart balance between weight, comfort, and stopping power. As a result, modern ballistic-resistant vests are often built using hybrid constructions that combine woven fabrics and unidirectional (UD) materials. This approach helps optimize overall performance without compromising the safety margin.
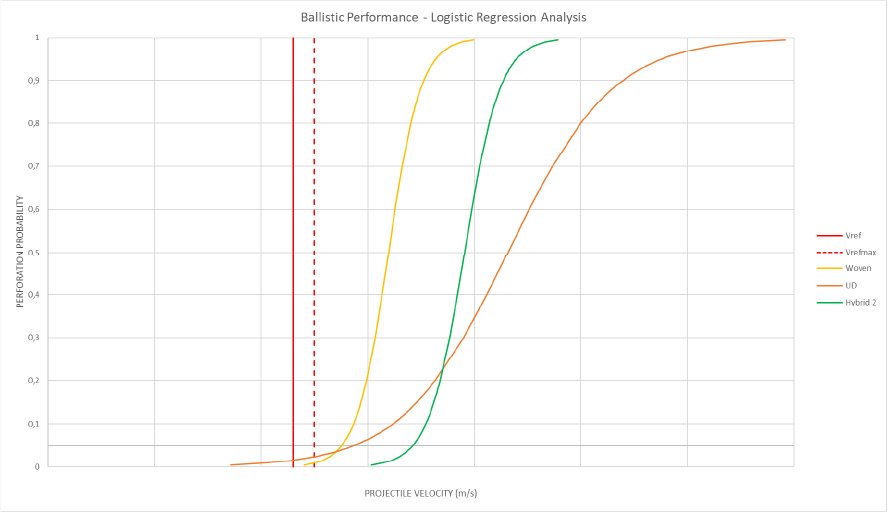
Figure 3 illustrates how hybrid systems can raise V05 levels, improving both predictability and reliability. Typical performance characteristics of these material types include:
- Woven fabrics: more flexible and comfortable, often resulting in a steeper S-curve and a narrower ZMR.
- UD materials: generally stiffer with higher specific energy absorption (V50), though they often exhibit a broader ZMR.
It’s important to remember, however, that while these performance characteristics are typical of the previously mentioned general material constructions, actual performance depends on the specific fabric and system design being evaluated.
A more complete view of armor performance
V50 remains a valuable benchmark for comparing ballistic efficiency and stopping power, particularly when evaluating material combinations or energy absorption. However, V50 alone does not reflect the full performance capability of a ballistic vest.
To better understand reliability under operational conditions, it is essential to include V05 and the shape of the S-curve in performance assessments. When V05 is high and the ZMR is narrow, it indicates that the armor consistently stops threats at the critical velocities most likely to occur in the field.
S-curve analysis provides a more complete picture, enabling designers, specifiers, and procurement teams to make informed decisions based on the probability of perforation across the full velocity range. It also supports the development of hybrid armor systems that balance weight, comfort, and ballistic performance while maintaining a sufficient safety margin.
With more than 35 years of experience in ballistic applications, Teijin Aramid supports armor developers at every stage, from material selection to system integration. Our Twaron®-based solutions, including woven fabrics and unidirectional (UD) materials, can be tailored to meet the most demanding performance requirements.
Want to better understand how V05 and S-curve analysis can improve armor reliability?
Watch our technical video or contact our team to explore how Twaron® solutions can support your ballistic system design.
Contact: Christian Boettger, Global Technology & Application Expert
Email: [email protected]
Learn more: teijinaramid.com/ballistics